一、canvas
canvas是HTML5新增的标签,用于提供“画布”
可以通过canvas元素获取对应的“上下文”(可以理解为画笔)来操作显示内容
canvas的标准属性有 width和 height (例如 id, class 这些都属于通用标准属性)
1 | width:表示canvas的宽 |
canvas 有一个默认宽高 在上面更改相当于是拉扯了画布,会影响画笔绘图。 要在标签上直接写宽高
举例:
1 | <canvas id="myCanvas" width="600" height="400"></canvas> |
样式:
获取画笔的方式:
①获取对应的canvas元素
1 | var canvas = document.getElementById("myCanvas"); |
②通过canvas元素获取画笔
1 | var ctx = canvas.getContext("2d"); |
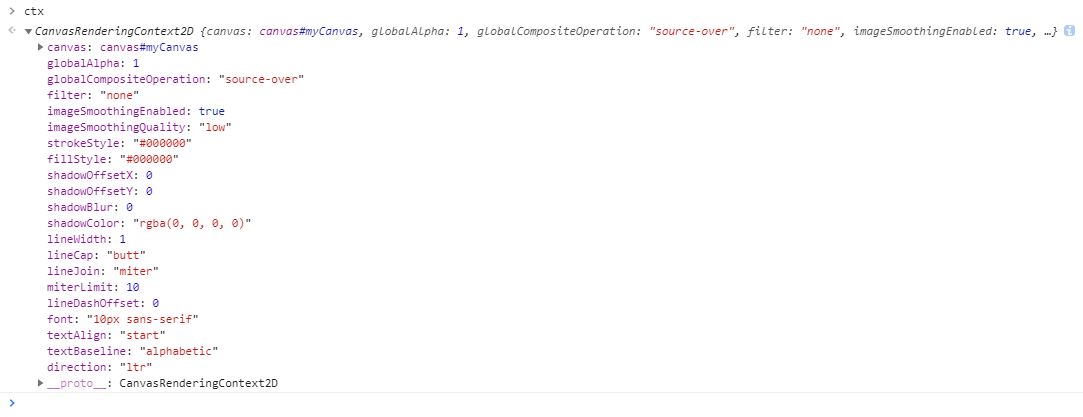
查看画笔:
属性:
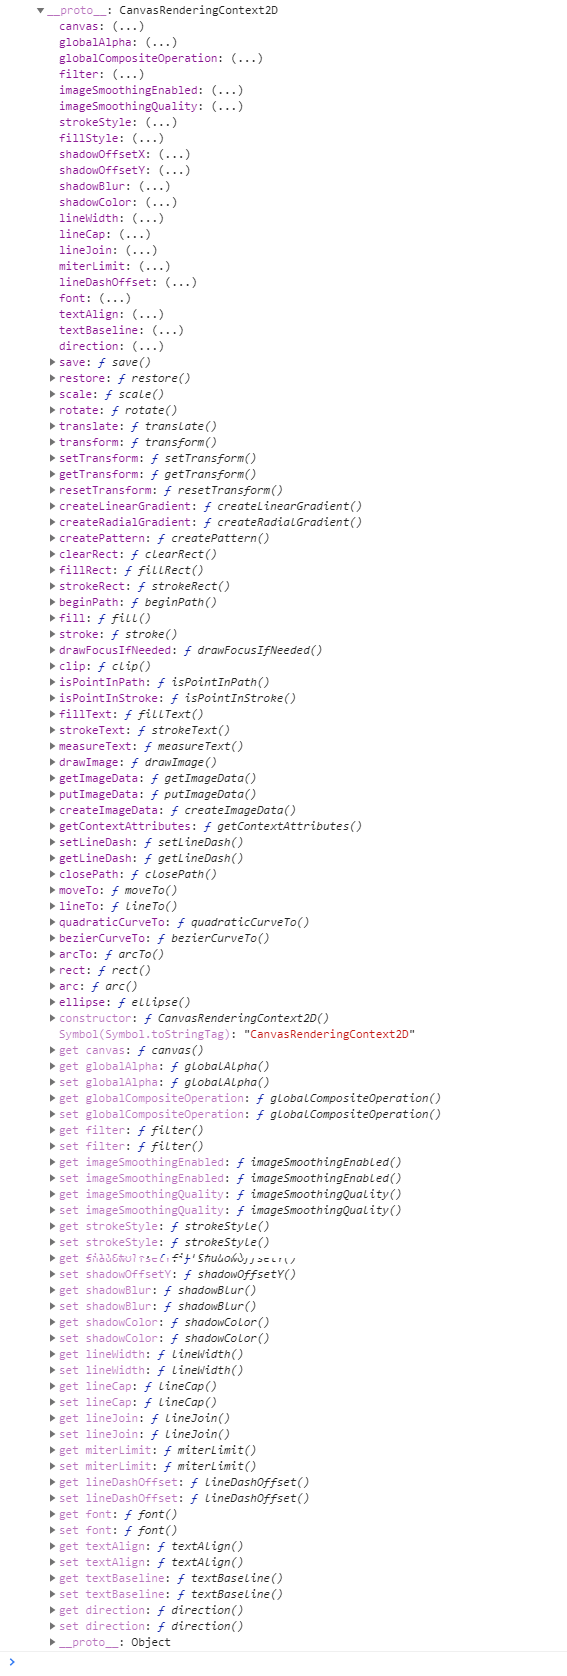
方法:
小案例:
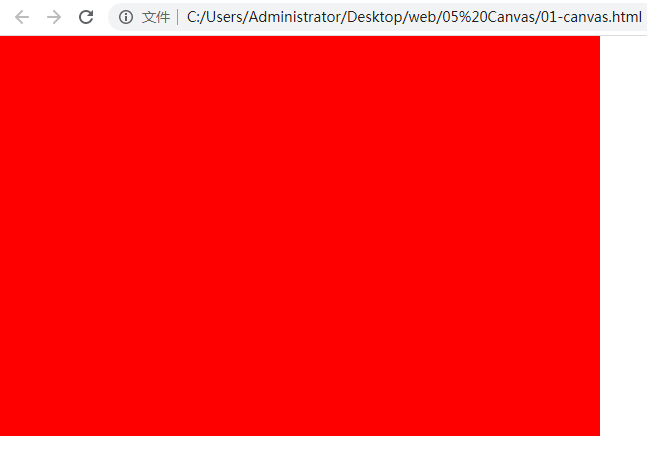
1 | // 改变画笔默认颜色 |
结果:
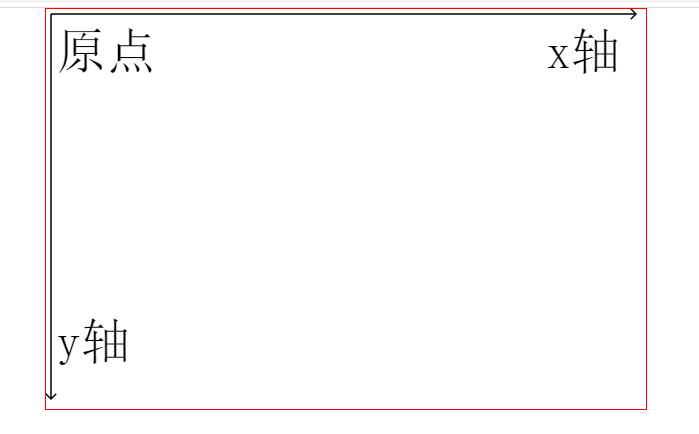
1.1 坐标系
canvas已经是最底层元素,没有子元素
所以定位坐标系对于canvas是没有意义的,但是canvas是用来显示图像的,所以自带了一个坐标系
默认与元素的定位坐标系方向一致
举例:
1 | // canvas 是一块区域,可以用来绘制内容,自带了一个坐标系 |
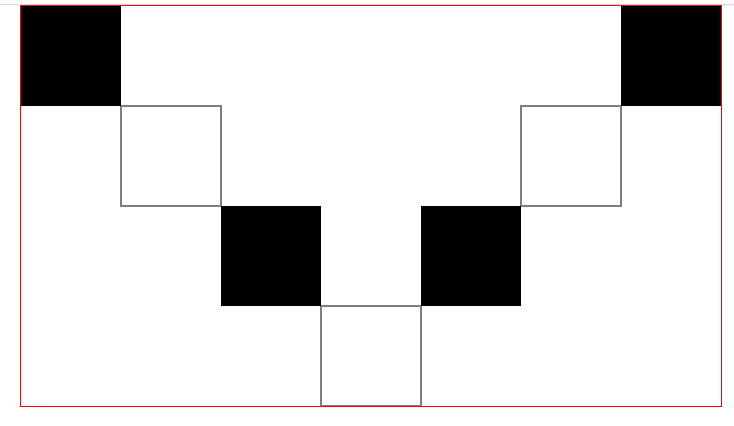
1.2 绘制矩形
1 | // 获取元素 |
1.3 API
beginPath();开启路径
1 | `canvas`上大部分都是在操作路径,所以在绘制图形之前要开启路径 |
关闭路径的时候,会在关闭时候的点和最开始时候的点之间形成一条线段
1 |
|
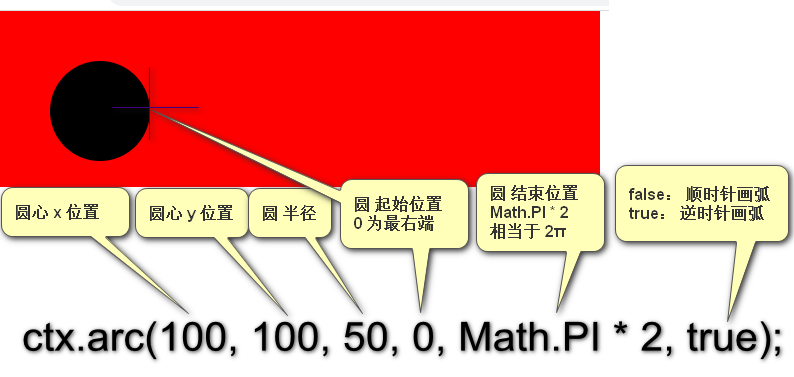
x:圆弧所在的圆心的 x 点
y:圆弧所在的圆心的 y 点
start:圆弧起始的位置
end:圆弧结束的位置
dir:绘制方向 不书写时默认为false
false:顺时针绘制
true:逆时针绘制
1 | >`ctx.moveTo(x1, y1); ` 移动画笔到某个位置 |
从 (x1, y1)绘制到(x2, y2)
1 |
|
如:ctx.fillText(“x轴”, 500, 60);
1 |
|
如:ctx.font = “50px 宋体”;
1 |
|
如:ctx.lineWidth = 3; 默认为 1
1 |
|
如:ctx.strokeStyle = “red”; 默认为 #000000
1 |
|
如:ctx.fillStyle = “white”;
ctx.fillStyle = “rgba(255, 255, 123, .5)”; 还可以改变透明度
1 |
|
strokeRext(x, y, w, h);绘制描边矩形
1 | x:当前坐标系中的 x 点 |
clearRext(x, y, w, h);清除矩形区域
1 | x:区域的 x 点(左上角) |